
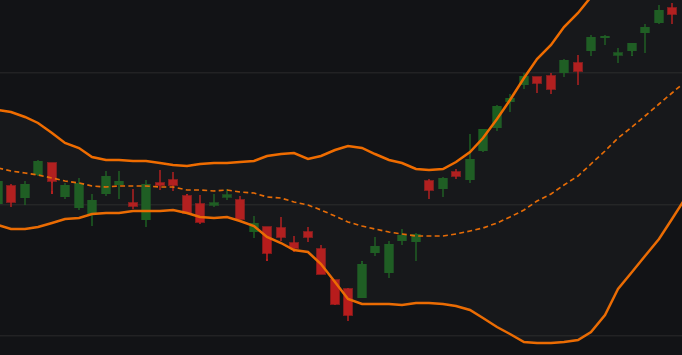
Bollinger Bands®
Volatility as standard deviation boundary from a moving average of price
Envelope and band indicators that define price range boundaries around a trend.
Volatility as standard deviation boundary from a moving average of price
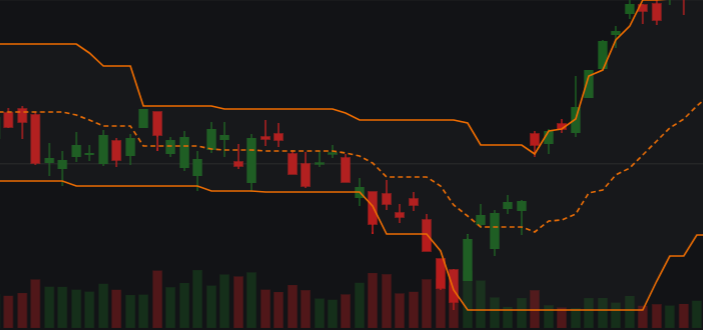
Price ranges derived from highest High and lowest Low
(aka Price Channels)
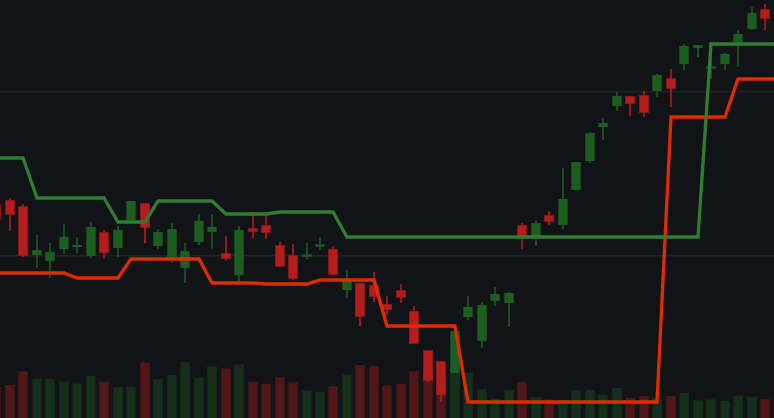
Fractal-based high and low price channels depicting less-chaotic price movement
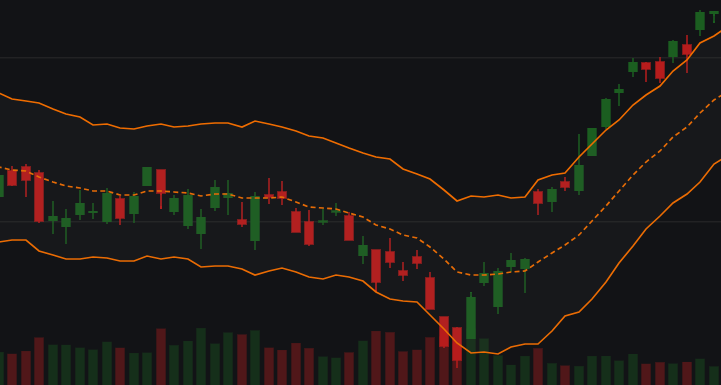
ATR channels around an EMA centerline
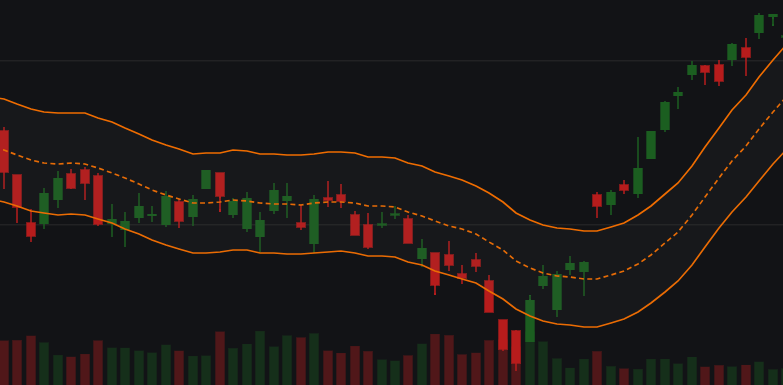
Percentage offset around different moving average types
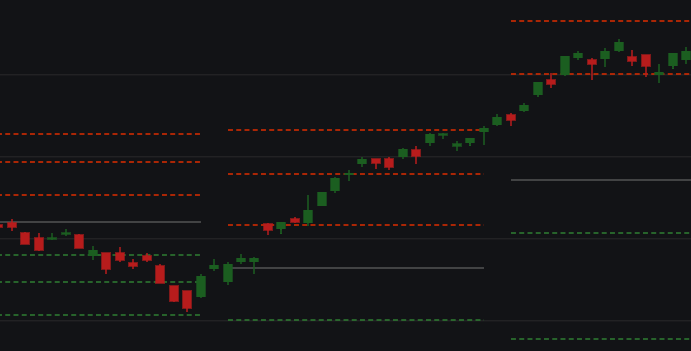
Classic support/resistance levels based on fixed calendar period (multiple styles)
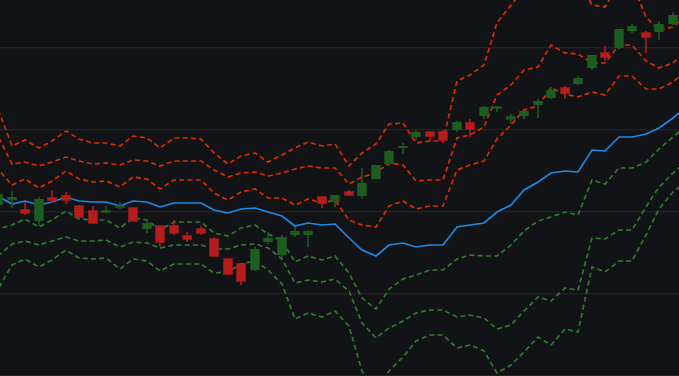
Support/resistance levels based on a rolling window period
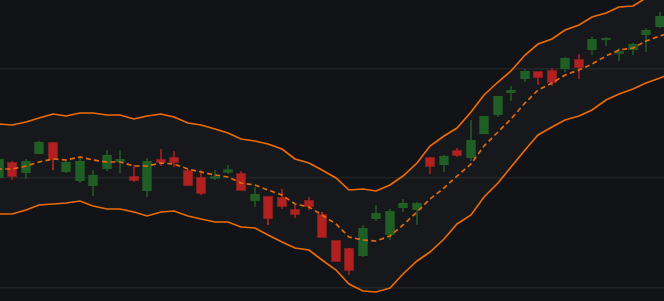
ATR channels around an SMA centerline
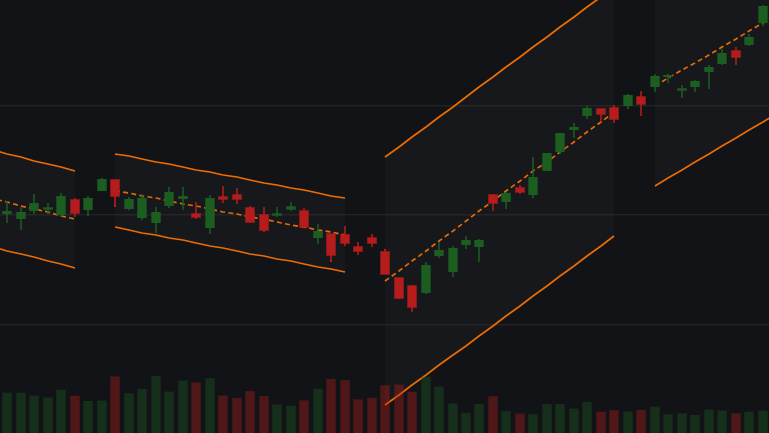
Standard Deviation Channels segmented by rolling window periods