SuperTrend
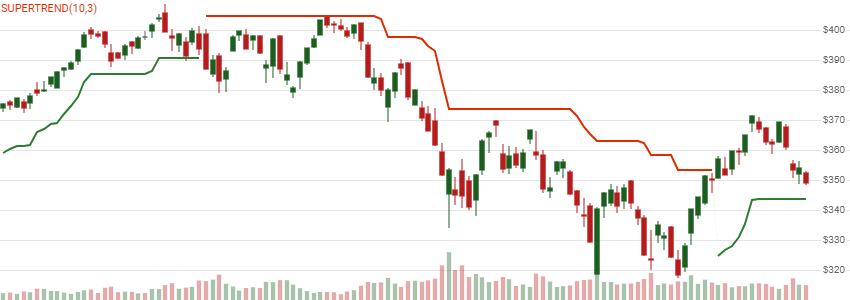
Created by Oliver Seban, the SuperTrend indicator attempts to determine the primary trend of prices by using Average True Range (ATR) band thresholds around an HL2 midline. It can indicate a buy/sell signal or a trailing stop when the trend changes. [Discuss] 💬
// C# usage syntax
IEnumerable<SuperTrendResult> results =
  quotes.GetSuperTrend(lookbackPeriods, multiplier);
Parameters
lookbackPeriods int - Number of periods (N) for the ATR evaluation. Must be greater than 1 and is usually set between 7 and 14. Default is 10.
multiplier double - Multiplier sets the ATR band width. Must be greater than 0 and is usually set around 2 to 3. Default is 3.
Historical quotes requirements
You must have at least N+100 periods of quotes to cover the convergence periods. Since this uses a smoothing technique, we recommend you use at least N+250 periods prior to the intended usage date for optimal precision.
quotes is a collection of generic TQuote historical price quotes. It should have a consistent frequency (day, hour, minute, etc). See the Guide for more information.
Response
IEnumerable<SuperTrendResult>
- This method returns a time series of all available indicator values for the
quotesprovided. - It always returns the same number of elements as there are in the historical quotes.
- It does not return a single incremental indicator value.
- The first
Nperiods will havenullSuperTrend values since there’s not enough data to calculate.
⚞ Convergence warning: the line segment before the first reversal and the first
N+100periods are unreliable due to an initial guess of trend direction and precision convergence for the underlying ATR values.
SuperTrendResult
Date DateTime - Date from evaluated TQuote
SuperTrend decimal - SuperTrend line contains both Upper and Lower segments
UpperBand decimal - Upper band only (bearish/red)
LowerBand decimal - Lower band only (bullish/green)
UpperBand and LowerBand values are provided to differentiate bullish vs bearish trends and to clearly demark trend reversal. SuperTrend is the contiguous combination of both upper and lower line data.
Utilities
See Utilities and helpers for more information.
Chaining
This indicator is not chain-enabled and must be generated from quotes. It cannot be used for further processing by other chain-enabled indicators.