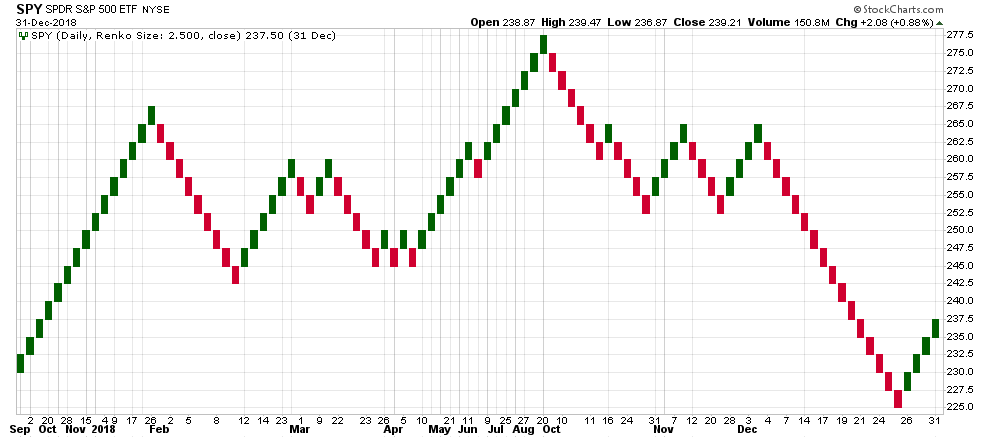
Renko Chart
The Renko Chart is a Japanese price transformed candlestick pattern that uses “bricks” to show a defined increment of change over a non-linear time series. Transitions can use either Close or High/Low price values. An ATR variant is also provided where brick size is determined by current Average True Range values. [Discuss] 💬
// C# usage syntax
IEnumerable<RenkoResult> results =
  quotes.GetRenko(brickSize, endType);
Parameters
brickSize decimal - Brick size. Must be greater than 0.
endType EndType - See options below. Default is EndType.Close
Historical quotes requirements
You must have at least two periods of quotes to cover the warmup periods; however, more is typically provided since this is a chartable candlestick pattern.
quotes is a collection of generic TQuote historical price quotes. It should have a consistent frequency (day, hour, minute, etc). See the Guide for more information.
EndType options
EndType.Close - Brick change threshold measured from Close price (default)
EndType.HighLow - Brick change threshold measured from High and Low price
Chaining
Results are based in IQuote and can be further used in any indicator.
// example
var results = quotes
    .GetRenko(..)
    .GetRsi(..);
This indicator must be generated from quotes and cannot be generated from results of another chain-enabled indicator or method.
Response
IEnumerable<RenkoResult>
- This method returns a time series of all available indicator values for the
quotesprovided. - It does not return a single incremental indicator value.
RenkoResultis based onIQuote, so it can be used as a direct replacement forquotes.
🚩 Warning: Unlike most indicators in this library, this indicator DOES NOT return the same number of elements as there are in the historical quotes. Renko bricks are added to the results once the
brickSizechange is achieved. For example, if it takes 3 days for a $2.50 price change to occur an entry is made on the third day while the first two are skipped. If a period change occurs at multiples ofbrickSize, multiple bricks are drawn with the sameDate. See online documentation for more information.
RenkoResult
Each result record represents one Renko brick.
Date DateTime - Formation date of brick(s)
Open decimal - Brick open price
High decimal - Highest high during elapsed quotes periods
Low decimal - Lowest low during elapsed quotes periods
Close decimal - Brick close price
Volume decimal - Sum of Volume over elapsed quotes periods
IsUp bool - Direction of brick (true=up,false=down)
🚩 Warning: When multiple bricks are drawn from a single
quoteperiod, the extra information aboutHighandLowwicks andVolumeis potentially confusing to interpret.HighandLowwicks will be the same across the multiple bricks; andVolumeis portioning evenly across the number of bricks. For example, if within onequoteperiod 3 bricks are drawn, theVolumefor each brick will be(sum of quotes Volume since last brick) / 3.
Utilities
See Utilities and helpers for more information.
ATR Variant
// C# usage syntax
IEnumerable<RenkoResult> results =
  quotes.GetRenkoAtr(atrPeriods, endType);
Parameters for ATR
atrPeriod int - Number of lookback periods (A) for ATR evaluation. Must be greater than 0.
endType EndType - See options below. Default is EndType.Close
Historical quotes requirements for ATR
You must have at least A+100 periods of quotes.
quotes is a collection of generic TQuote historical price quotes. It should have a consistent frequency (day, hour, minute, etc). See the Guide for more information.
Response for ATR
IEnumerable<RenkoResult>
- This method returns a time series of all available indicator values for the
quotesprovided. - It always returns the same number of elements as there are in the historical quotes.
- It does not return a single incremental indicator value.
👉 Repaint warning: When using the
GetRenkoAtr()variant, the last Average True Range (ATR) value is used to setbrickSize. Since the ATR changes over time, historical bricks will be repainted as new periods are added or updated inquotes.